Unit 2 / Weeks 6 through 9

An archive is defined as an accumulation of records, in any medium. Archives exist both to preserve historic materials and to make them available for use. When designing for an ever-evolving digital future, how can we imagine new forms of the immaterial archive?

This type of content can be dynamic—when existing online it can grow, it can be experienced differently from user to user. We’ll explore the history of the archive, how data fuels our websites and how to design an elastic collection. We’ll discuss private and public use of data—from open source to social media and how our data is being used to drive decisions today.

Project 2 / Due 03.26

Anything that you have an accumulation of can be a collection. For our next project you’re tasked with creating a collection of 25 to 50 items. It is highly encouraged to either gather your collection through unconventional means, or create this collection yourself through photos, drawings, etc. (consider the various image-making techniques we’ve explored together). Your collection should have at least five different data types affiliated with it, and should be as specific as possible. There should be a visual consistency between the items, and should have a cohesive story to it.

For example: If your collection is “Objects of Desire” you might include: photos of items in window displays you’ve coveted in the last few months, the name and brand of each item, its price, the GPS coordinates or neighborhood where you saw this item, and a brief description of the experience. Once you collect your data, you will organize it into a local database and create a JSON file that houses all the relevant content.

Once you have your data collected and collection organized, you’ll design a webpage that houses the collection. Link the JSON file and pull the data in programmatically to display your content. Consider how the collection is organized and experienced — one at a time, in a grid, on separate pages? Consider if there are groupings within your collection and how the relationship between typography and mixed media can add a visual perspective to your work.

Any time you see a multiplicity of an object, you begin to notice similarities and contexts in a new way. Seeing multiple of an object allows for this kind of in depth research that observing one object does not. The way the object is documented and organized helps direct the viewer on how the object is meant to be experienced.

Objectives
To gather and organize a collection of data.
To understand metadata.
To tell a story through content curation and order.
To experiment with interactions with a collection.
To develop a working relationship of JavaScript objects and data collection.

Requirements
A title for your collection.
You should pull your data in with a JSON file or using JavaScript objects.
Must be responsive and function on a mobile screen.

Considerations
Point-of-View: What is text? What is writing? How do you see or read this particular text? The most successful projects have 1 point of view that is expressed through a decisive design move (some examples below).
Typography: How does the typography enhance your point of view and help you convey meaning? Pay attention to typographic details: special characters, leading, words per line, etc.
Links: How do internal/external links enhance the meaning of this text?
Scale of the Page: What happens to your site when the browser window is resized? Is it the same? Is it a different design? Are only certain information accessible at certain sizes?
Do not try to illustrate the text. The least successful projects are ones that try to visualize the text literally.

Unit 3 / Weeks 10 through 15

Data is all around us, though not always accessible—on its own a set of numbers is difficult to comprehend without a visualization. We’ll learn about storytelling to increase visibility and to craft compelling narratives around data, as well as the user-centered design process and how it shapes our design decisions. Through examining both public and private data use, we’ll form more personal relationships with data and see how it impacts the world around us.

Unit 3 Guest lecturers: Folder Studio, Tiger Dingsun, Qiang Wang, XXIX, Hwa-Jin Jun, Christian Townsend, Madeline Montoya

Project 3 / Due 05.07 and 05.09

Part One: For this project, you can either choose to work with the Metropolitan Museum of Art Collection API or with data from NASA. Look through your chosen data and consider how you can tell a story through different subsets of it. Think through the relationship between the form, the story, and the data itself. How does the data’s designed container help encourage a unique understanding or perspective?

Part Two: Explore possible narrative components to the data based on how you filter it and categorize it. You may work with the full set of data, or just a segment. Consider different possible narratives that could have produced this data, either telling someone else’s story or crafting a larger statement about the world at large. Then form your own relationship to this story. Your personal narrative could work as an enhancement, or act to provide contrast.

Various images of spirals found within nature
FIG 3 (A-D)

Part Three: Choose two different mediums or formats you will use to tell this story. For example, you can pair a zine, a poster, or a simple app prototype to develop alongside a website as your final project. How does the story of the data change based on the form?

Think about how these two mediums interact with each other. They should not be one-to-one translations of each other; instead your design system and storytelling should transform and shift across platforms.

Think consciously of the interactions that will be inherent to your project, and how they aid your concepts (the interactive components don’t need to be limited to digital!). For example, if you decide to create a magazine and a website in tandem, the print component could house your personal narrative, which is then altered through the context of your dataset in the web component. Maybe both formats are meant to be read simultaneously, one page of the book and then one page of the site, to form a cohesive story.

Feel free to add in mixed media content to help tell this story. Don’t use traditional data visualizations such as bar graphs and pie charts, instead focus on storytelling and the objectives we learned through the semester that can come together in this final piece.

Various images of spirals found within nature
FIG 4

Objectives
To reinterpret external sources of data into narrative experiences.
To develop an editorial perspective to found content that is not your own.
To develop a working relationship with external content and code.
To connect and use structured content from an API (Application Programming Interface).

Considerations
Who is the audience? What mindset should the user be in when he/she uses the site? (Be specific!)
How does the user know what to do based on the design?
Does the type of content give form to your site?
How can you tell a story through a curated set of text, visuals, interactive experiences?
Rather than being a neutral vessel, how can the design that you use to organize your collection change when the collection itself changes? For example, do colors on the site change in response to the kind or amount of content posted to the site?

FIG 3: A / "La Mécanique des Couples" (year unknown), Gilbert Garcin. B / "Connections" (1929), Anton Stankowski. C / "Sehkanal" (1968), Franz Erhard Walther. D / Photo by Julia Hetta, found in Pleasure Garden Magazine n°6.
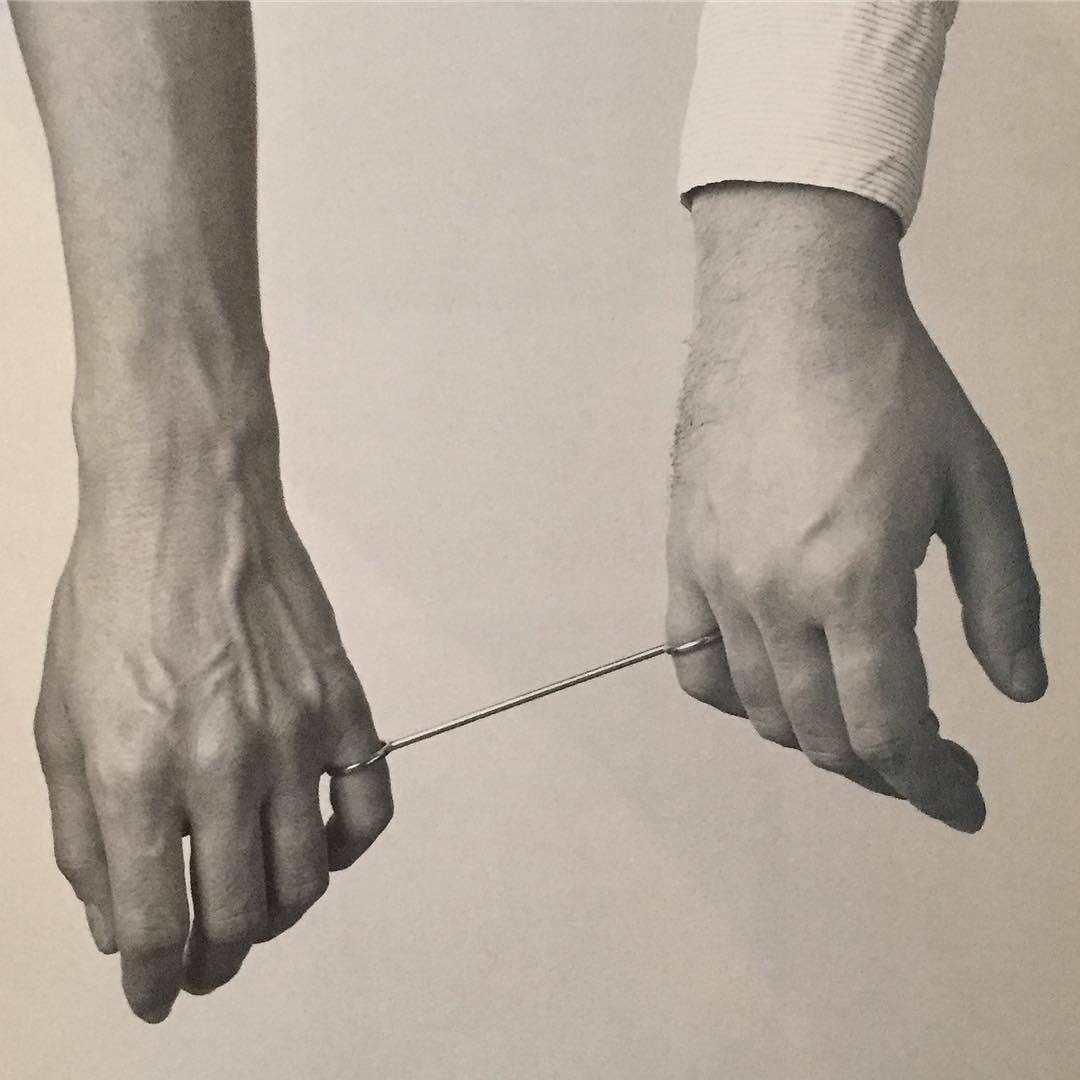
FIG 4: "Ring für zwei Personen" (1980), Otto Künzli.